Banking Analytics Dashboard | Financial Data Visualization & Business Intelligence
Fadoju Ifeoluwa Ebenezer
Published
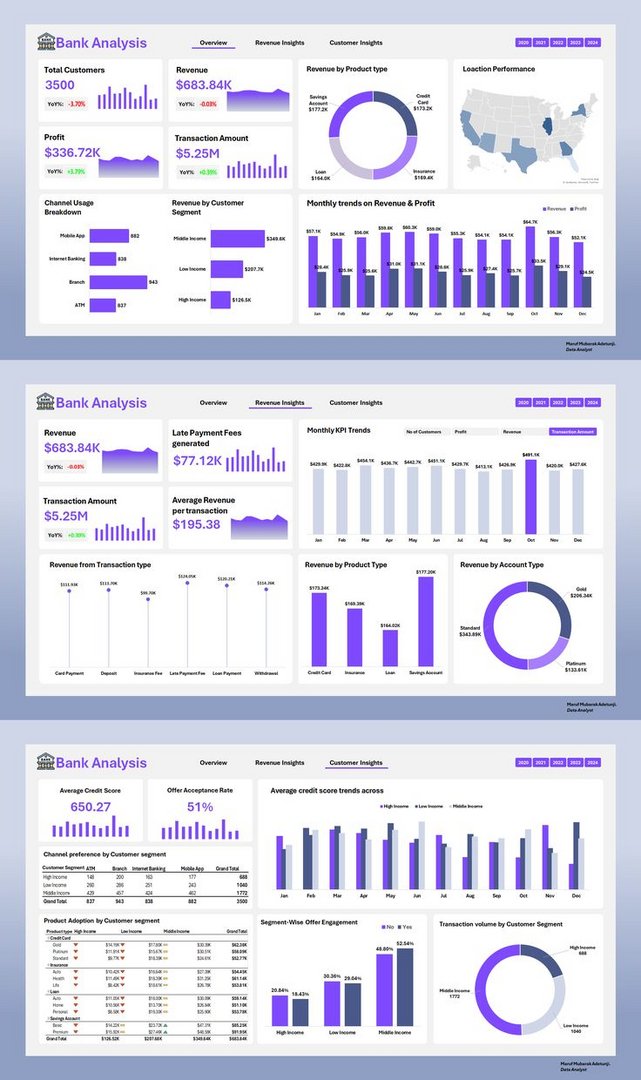
Designed a comprehensive banking analytics dashboard to transform financial data into actionable business insights. The dashboard features three interactive views: Overview, Revenue Insights, and Customer Insights, providing a clear picture of banking performance across key financial and customer metrics.
The Overview Dashboard presents key performance indicators, including total customers, revenue, profit, transaction amounts, product performance, channel usage, customer segments, and geographical distribution.
The Revenue Insights Dashboard explores revenue sources, late payment fees, average revenue per transaction, monthly KPI trends, transaction types, product performance, and account distribution.
The Customer Insights Dashboard focuses on customer credit scores, offer acceptance rates, channel preferences, product adoption, customer segment engagement, and transaction volume across income groups.
With a consistent visual design, clear KPI cards, interactive-style charts, and organized data visualizations, this dashboard helps stakeholders identify trends, evaluate performance, and make data-driven business decisions.