Navigating Categories and Unveiling Detailed Insights
Boudewijn
Published
0
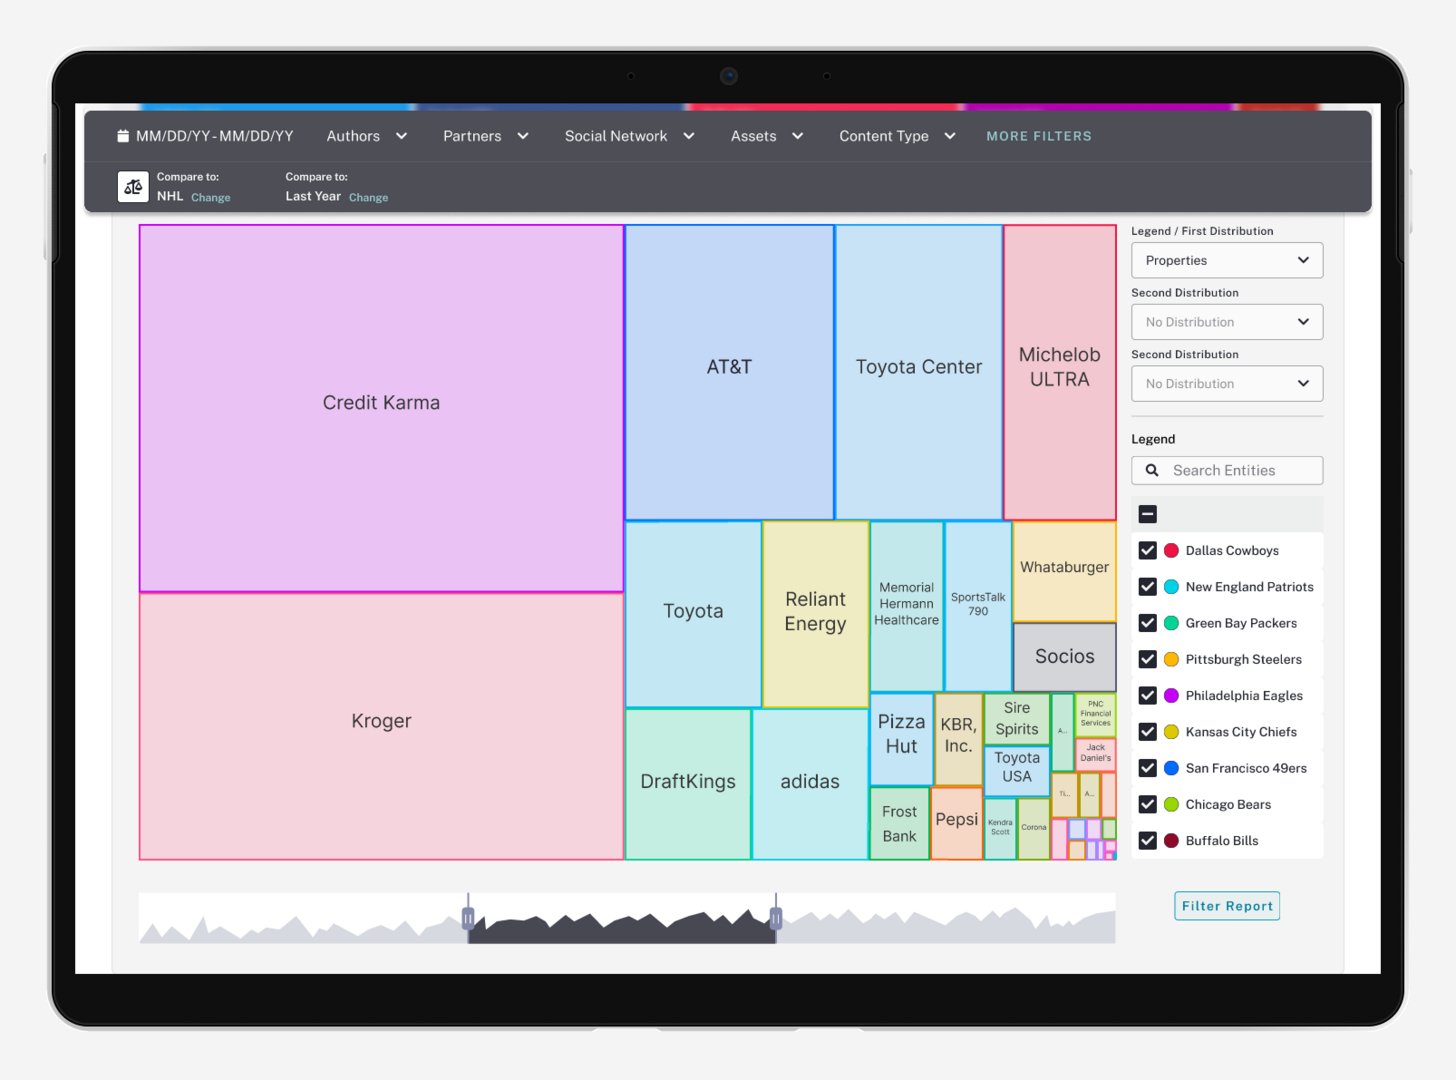
The distribution chart illustrates categories, allowing for a comparison of their total values. The tree map design enables the distribution of parts across up to three levels, providing users with the functionality to drill down into more detailed insights of how a value is build.