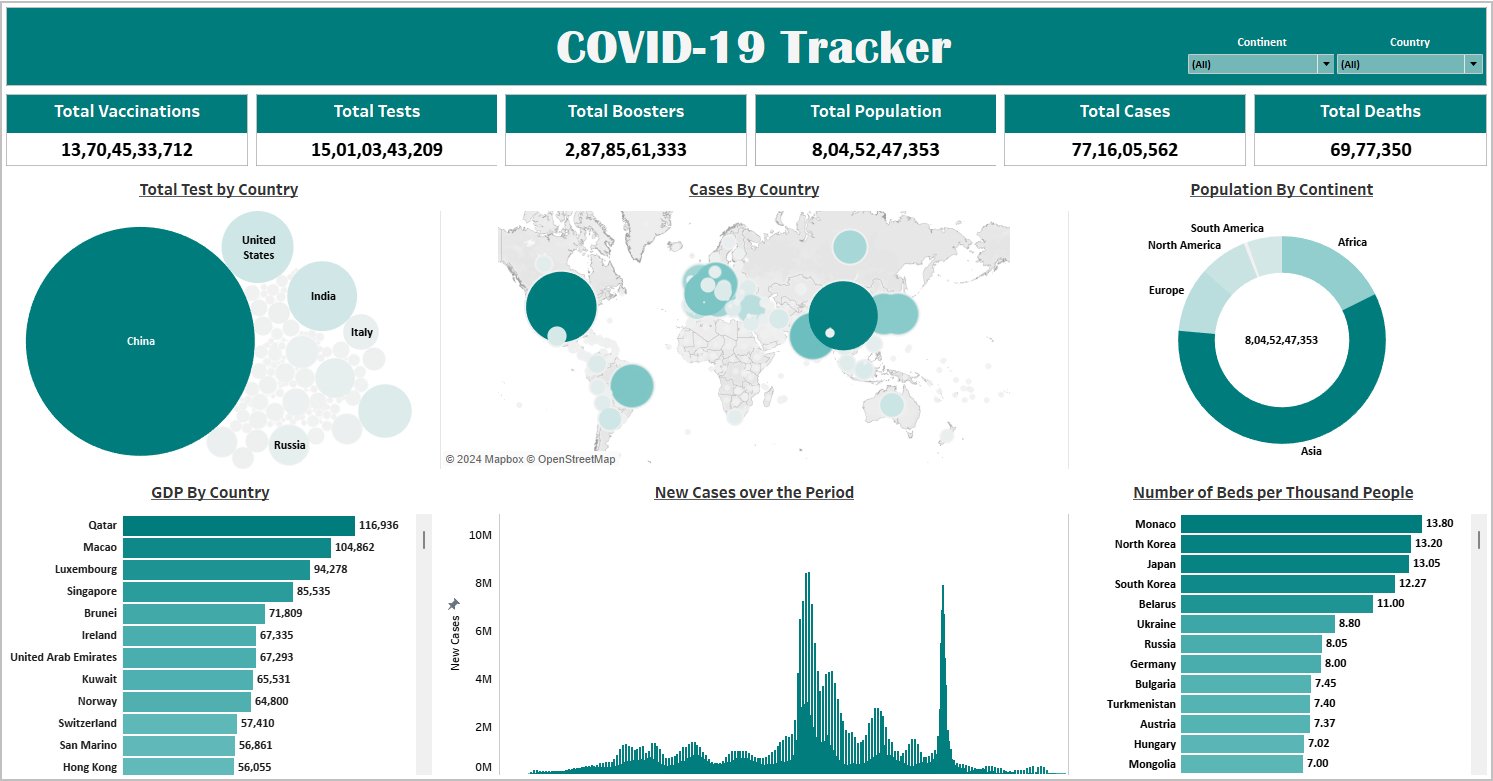
Covid 19 Tableau Dashboard
Prashant Dalmia
Published
0
I developed an interactive Tableau dashboard to track and analyze COVID-19 data. The dashboard includes real-time updates on case numbers, vaccination rates, and regional trends, allowing users to explore the impact of the pandemic through dynamic visualizations. This tool enhanced data accessibility and informed critical decision-making for health authorities and the general public."