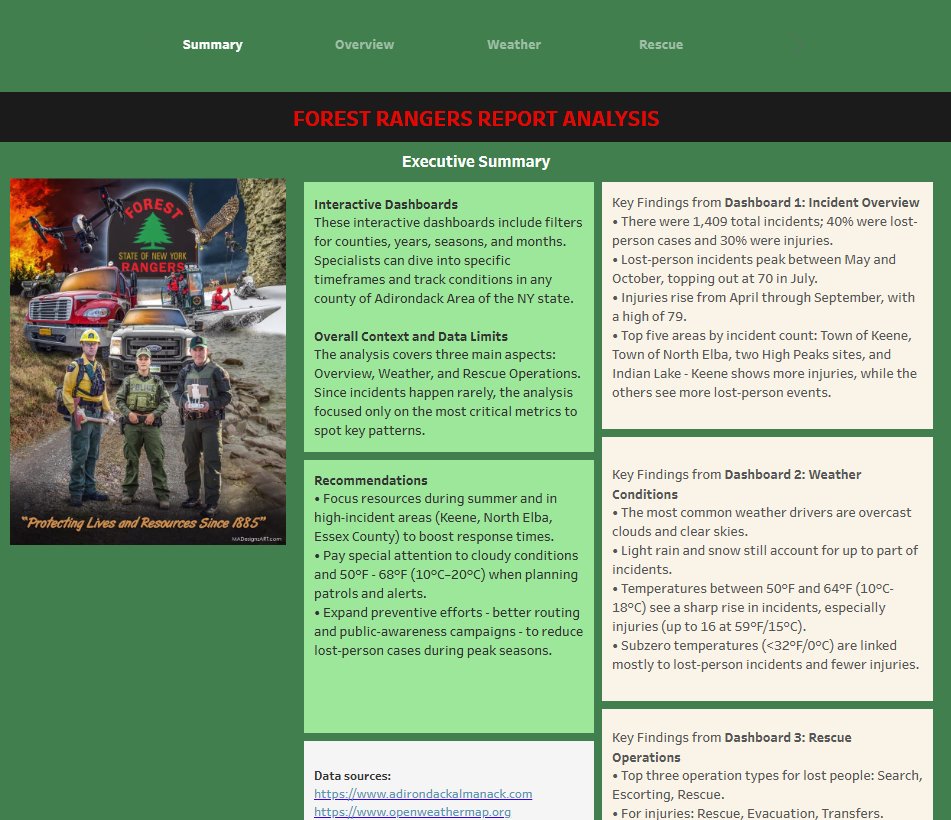
Analytical report with analysis of the Adirondack National Park rangers' work
Ilia Mamontov
Published
0
PET PROJECT
Execution time: September 2024 – September 2025, episodically
Result: Tableau interactive dashboard - https://www.twine.net/signin
Completed work and applied tools
0. Planning
0.1. Setting goals - SMART framework
0.2. Planning - PSW framework
- Data preparation
1.1. Data Cleaning - CSV, Google Sheets
1.2. Creating categories for incidents - Google Sheets, Google App Script
1.3. Adding geo-coordinates - Python, Google Maps API
1.4. Getting weather data - Python, API openweathermap.org - Research analysis
2.1. Data significance analysis - Python, calculation of sampling power
2.2. Correlation analysis of parameters - Python, corr(), seaborn.heatmap()
2.3. Basic statistics and visualization - Python, seaborn()
2.4. Frequency of incidents depending on the weather - Tableau
2.5. The impact of weather conditions on the causes of incidents - Tableau
2.6. Distribution of types of rescue operations - Tableau - Creating dashboards and storyline in Tableau
3.1. Layout of charts and dashboards
3.2. Uniform stylistic design
3.3. Storyline formation
3.4. Executive summary page layout
3.5. User Testing
3.6. Revision of schedules
3.7. Final layout of dashboards
3.8. Publication
#datavisualization #dashboard #tableau