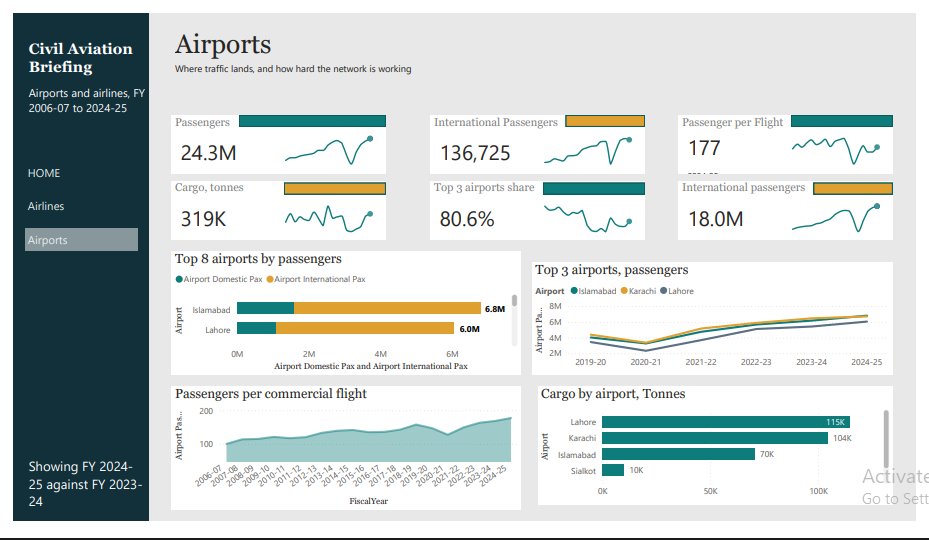
Pakistan Civil Aviation: Presidential Briefing (Power BI)
JEELAN RAZA
Published
0
Tagline: Executive dashboards on airline and airport performance, FY2006-07 to 2024-25.
Goal: Give senior leadership a high-level view of airline and airport traffic, with the COVID impact highlighted.
Data: Airlines and Airports CSVs covering 19 fiscal years.
Tools: Power BI, Power Query, DAX.
What I did: Cleaned the raw files, built a star-schema model (fact tables plus airline and year dimensions), wrote DAX measures, and designed a 3-page report (Home, Airlines, Airports)
Features: KPI cards and charts per page, a COVID-impact highlight, and cargo and mail in million tons.