BrightCart Online Retail Performance Dashboard
Modinat Omolara Buhari
Published
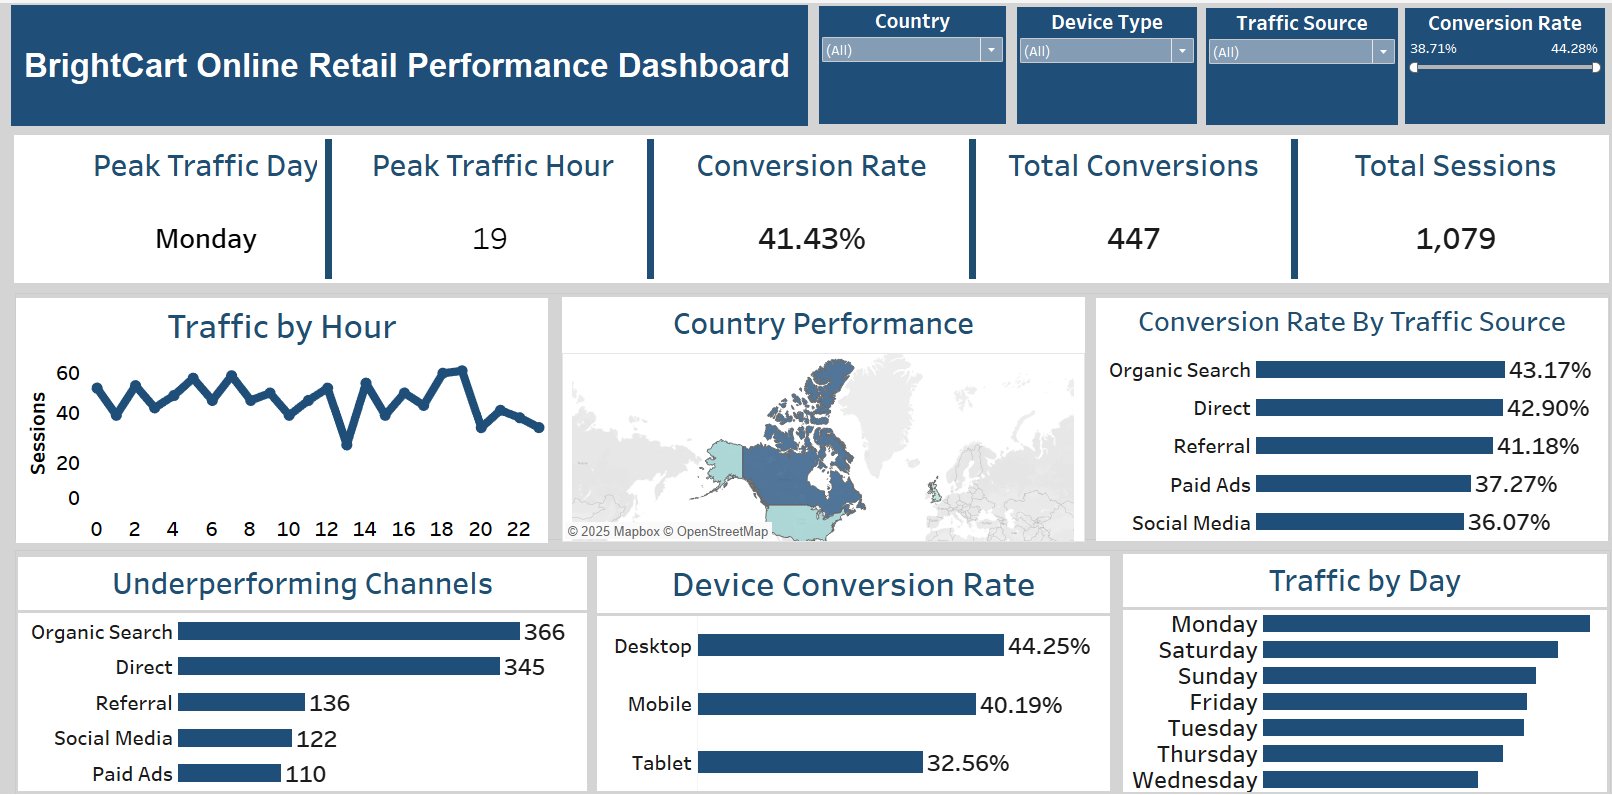
This project analyses the online retail performance of BrightCart, a fast-growing e-commerce company, using real-world business metrics. The goal was to uncover traffic patterns, conversion performance, and underperforming channels to support data-driven decision-making.
Using Microsoft Excel, the data was cleaned, structured, and explored to ensure accuracy. Tableau was then used to build an interactive dashboard that visualizes key performance indicators (KPIs) such as peak traffic periods, conversion rates, traffic sources, device performance, and country-level insights.
Key Insights:
Monday is the peak traffic day, with the highest activity occurring around 7 PM (19:00).
Organic Search and Direct traffic drive the strongest conversion rates.
Desktop users convert better than Mobile and Tablet users.
Paid Ads and Social Media channels show lower conversion performance, indicating optimization opportunities.
Interactive Tableau Dashboard:
Business Impact:
The dashboard helps stakeholders quickly identify high-performing channels and peak periods, optimize marketing spend, and improve conversion strategies across devices and regions.
Tools Used:
Microsoft Excel (data cleaning & preparation)
Tableau (data analysis & interactive visualisation)
#dataanalytics #dataanalysis #tableau #tableaudashboard #businessintelligence #excel #ecommerceanalytics