Commercial Sales Performance & Returns Impact Intelligence Dashboard | Excel & Power BI
AHMED AFIFY FAHMY
Published
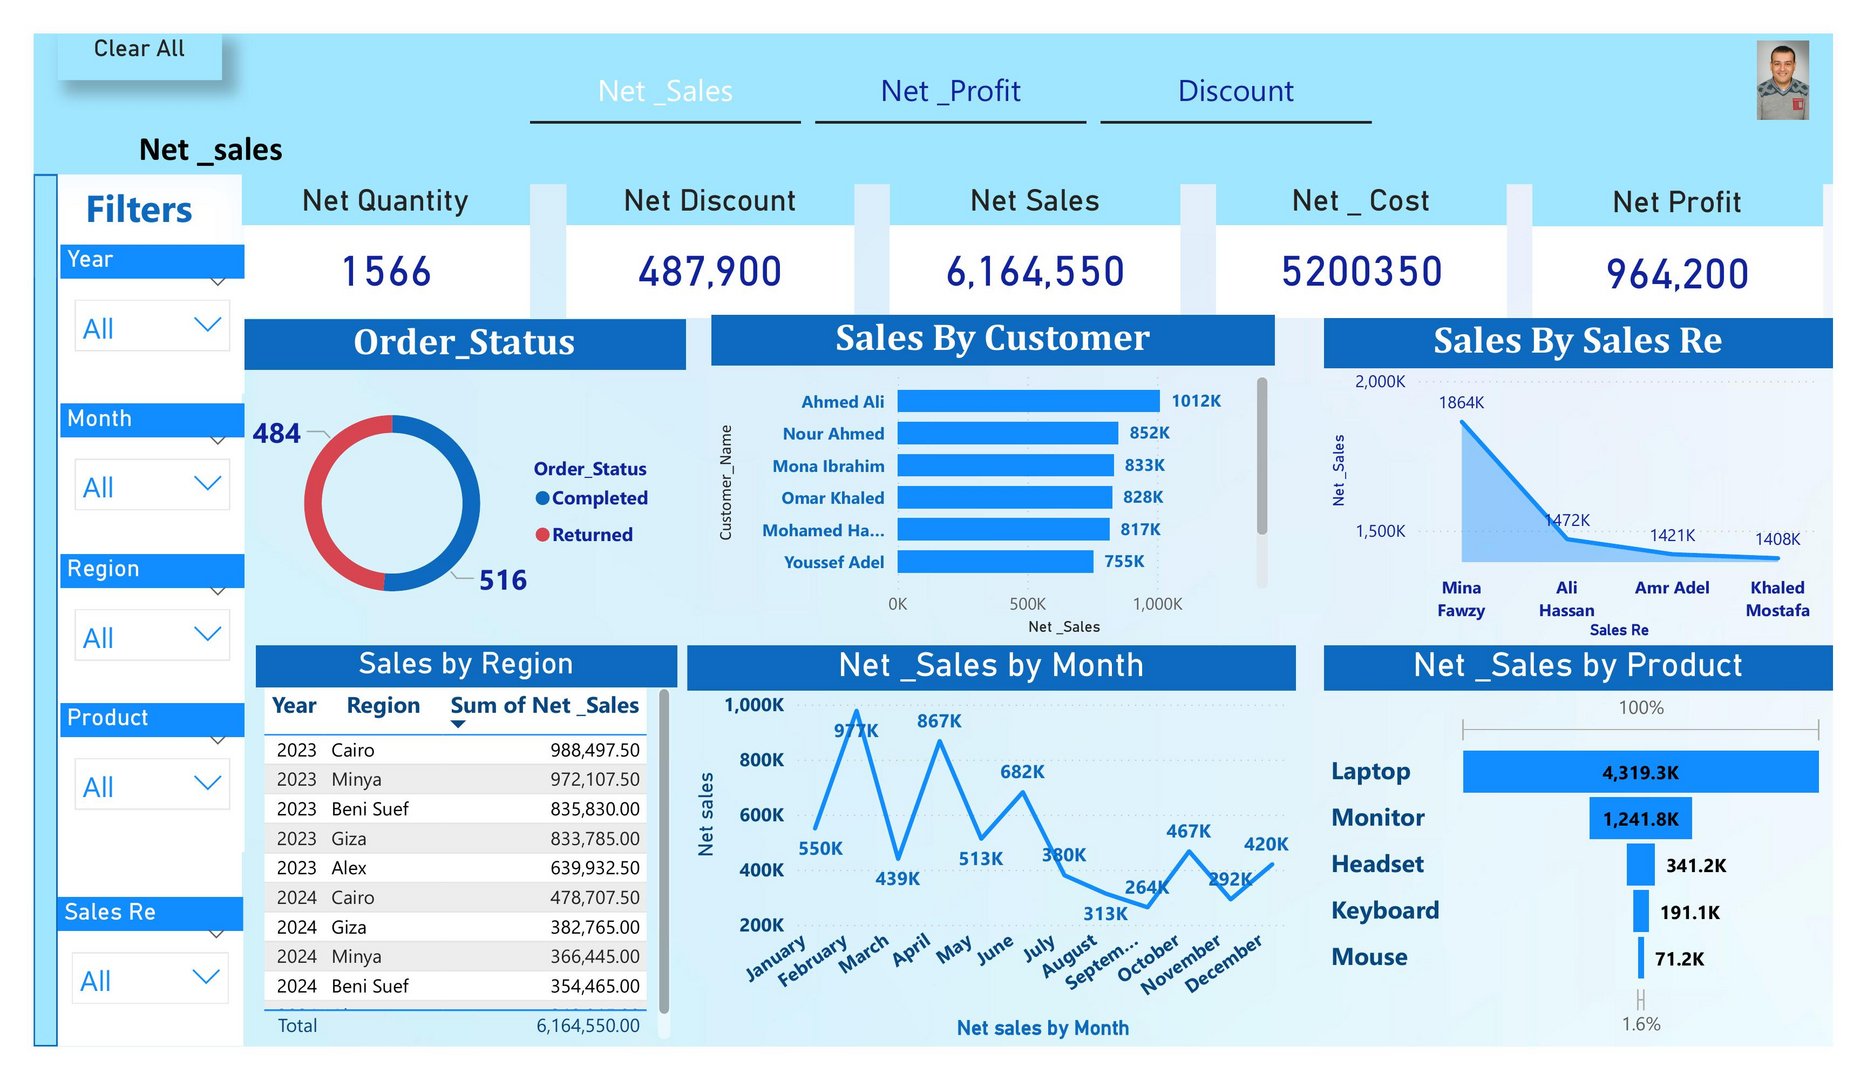
Engineered an executive-level Commercial Analytics Dashboard in Power BI analyzing multi-year transactional sales performance, product profitability, and the financial impact of customer returns. Key Financial & Business Metrics Delivered:
• Revenue & Profitability: Evaluated 6.16M EGP in Total Net Sales across 1,566 net units, yielding 964.2K EGP in Net Profit against 5.20M EGP in Net Cost and 487.9K EGP in discounts.
• Returns Financial Impact: Isolated return behavior showing 913.5K EGP in lost profit due to returned orders across 1,462 returned units, identifying Laptops and Headsets as the highest returned products and Giza as the top return region.
• Regional Performance: Identified Minya (228.6K EGP profit) and Cairo (199.3K EGP profit) as the primary profit drivers, while uncovering margin erosion in regions with elevated discounts and return rates.
• Product & Sales Rep Dynamics: Highlighted product margins (Laptops generating 4.3M in sales and 587.3K in profit) alongside individual sales representative contribution (led by Mina Fawzy with 1.86M sales / 302K profit). Tech Stack & Analytics Deliverables: Excel, Power Query (ETL & hygiene), Power BI (Relational Data Modeling, DAX measures for Net/Gross variance, dynamic slicers for Year/Region/Product, and Gauge margin monitoring)