Sales Forecast | Illustrated Model Walkthrough
Y Liu
Published
0
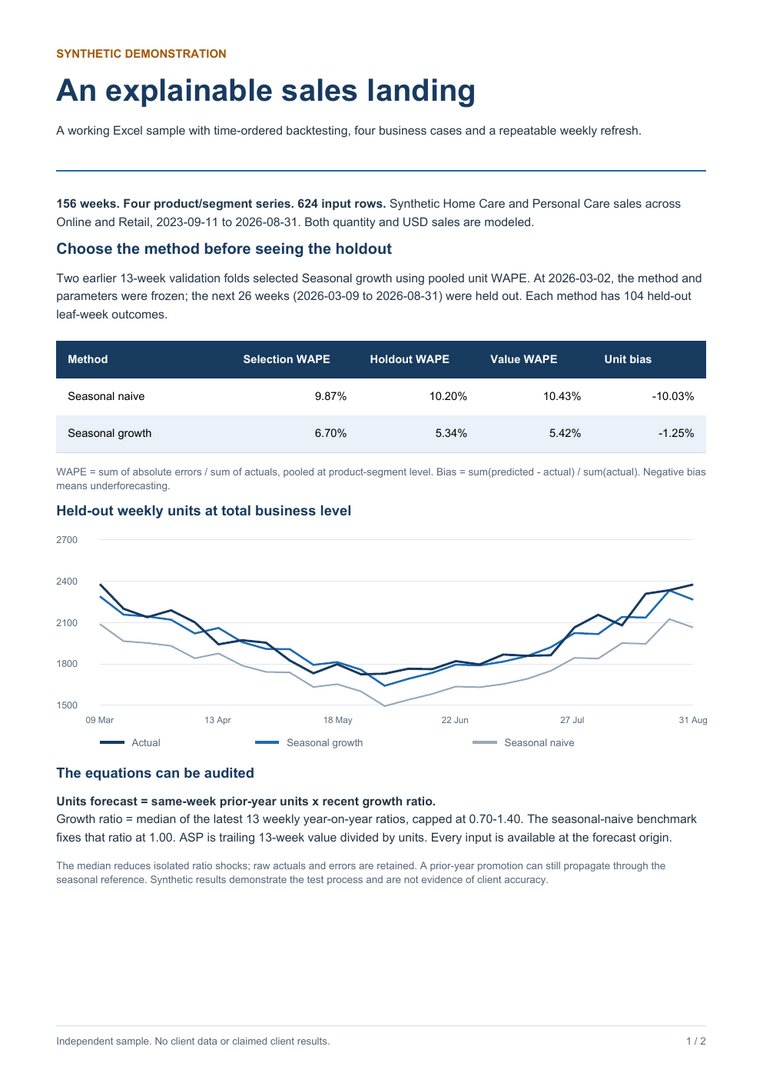
Synthetic demonstration: 156 weeks of history across four fixed series, two seasonal methods and a frozen 26-week holdout. Recorded unit WAPE was 5.34% versus the seasonal-naive benchmark of 10.20%. The workbook contains four assumption scenarios and a repeatable weekly refresh. These are sample results, not a client outcome or forecast guarantee.
This illustrated page accompanies the complete case: https://www.twine.net/signin