Speexx Infographics
Joe O'Shea
Published
Turning complex data into clear, visual stories for global audiences.
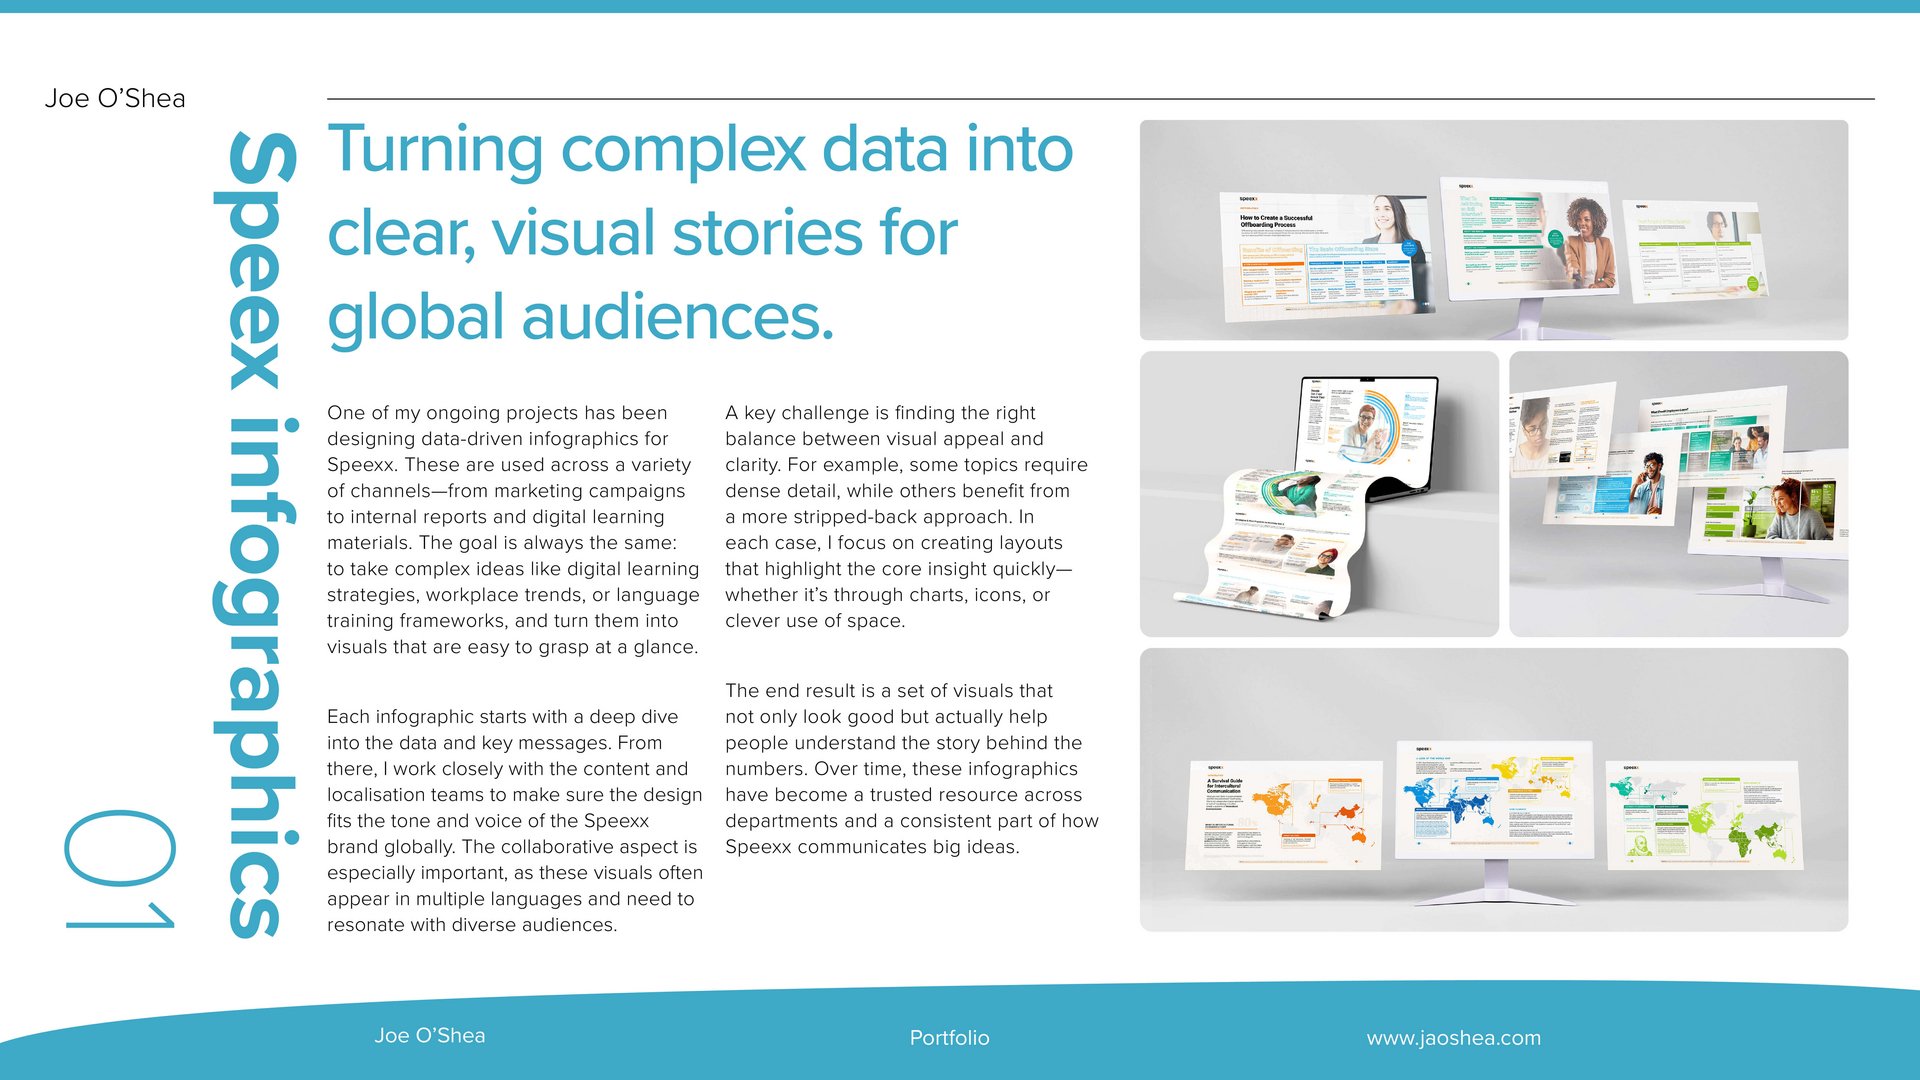
One of my ongoing projects has been designing data-driven infographics for Speexx. These are used across a variety of channels—from marketing campaigns to internal reports and digital learning materials. The goal is always the same: to take complex ideas like digital learning strategies, workplace trends, or language training frameworks, and turn them into visuals that are easy to grasp at a glance.
Each infographic starts with a deep dive into the data and key messages. From there, I work closely with the content and localisation teams to make sure the design fits the tone and voice of the Speexx brand globally. The collaborative aspect is especially important, as these visuals often appear in multiple languages and need to resonate with diverse audiences.
A key challenge is finding the right balance between visual appeal and clarity. For example, some topics require dense detail, while others benefit from a more stripped-back approach. In each case, I focus on creating layouts that highlight the core insight quickly—whether it’s through charts, icons, or clever use of space.
The end result is a set of visuals that not only look good but actually help people understand the story behind the numbers. Over time, these infographics have become a trusted resource across departments and a consistent part of how Speexx communicates big ideas.