Data-Driven Dashboard Presentation Design
Tiras Moresha
Published
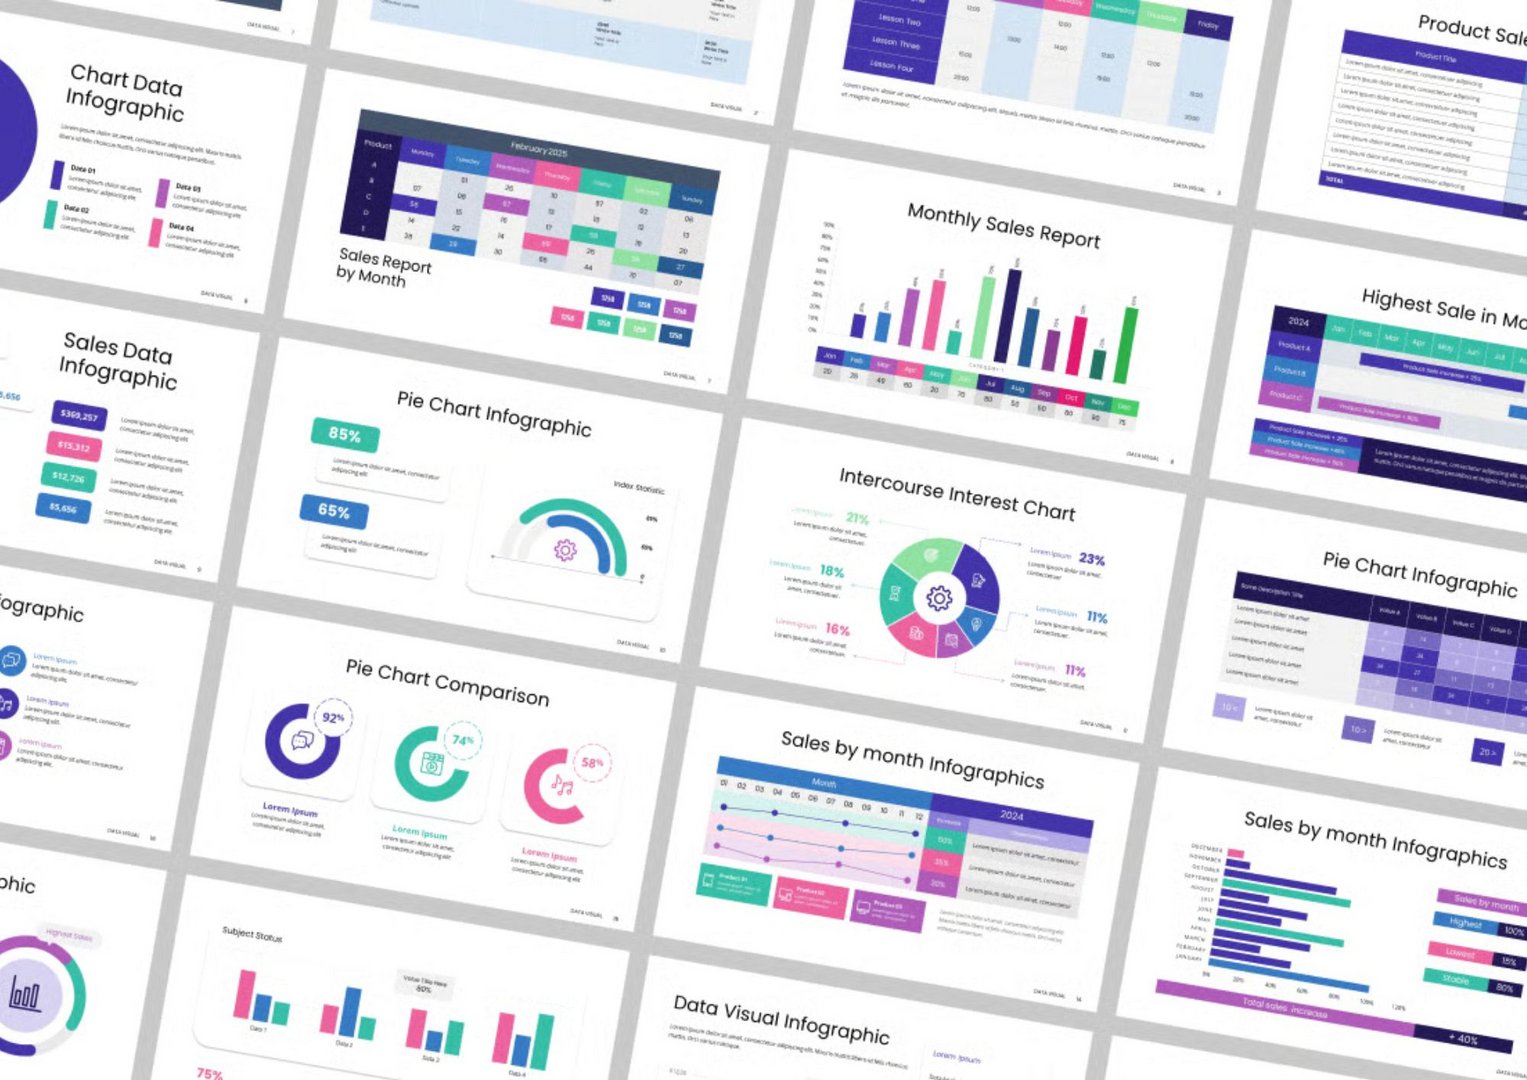
This project features a dynamic presentation template designed to visualize complex data in a simple, clear, and aesthetically engaging way. The layout caters to data analysts, business teams, marketers, and tech founders who need to communicate insights effectively.
Design Objectives
Translate dense datasets into clean, digestible infographics
Use consistent color schemes (cool purples, teals, and magentas) for intuitive data grouping
Build modular, editable templates for monthly, quarterly, and comparative reporting
Make charts presentation-ready for stakeholders and boardrooms
Key Features
Versatile Infographics: Pie charts, bar graphs, tables, calendars, and donut charts tailored to business KPIs
Data-Focused Aesthetic: Crisp layout with strong alignment and minimal distraction
Responsive Grid System: Easily adaptable to any presentation software (PowerPoint, Keynote, Google Slides)
Customizable Elements: Icons, labels, legends, and text fields designed for easy editing
Use Cases
Monthly and quarterly sales reports
Product performance dashboards
Marketing analytics & campaign tracking
Financial presentations and board reports
Tools Used
Figma | PowerPoint | Google Slides
Client Value
With this template, clients can streamline data storytelling and eliminate confusion during high-stakes presentations. The visual clarity not only boosts comprehension but also enhances the impact of decision-making insights.
#DataVisualization#InfographicDesign#BusinessDashboard#SalesReportDesign#MonthlyReports#AnalyticsDesign#PowerPointDesign#SlideInfographics#VisualData#PresentationDesign#PitchDeckDesign#BusinessTemplates#ReportDesign#InvestorReports#DataDrivenDesign#CorporateDesign