Editorial Infographic
DISHA MODI
Published
0
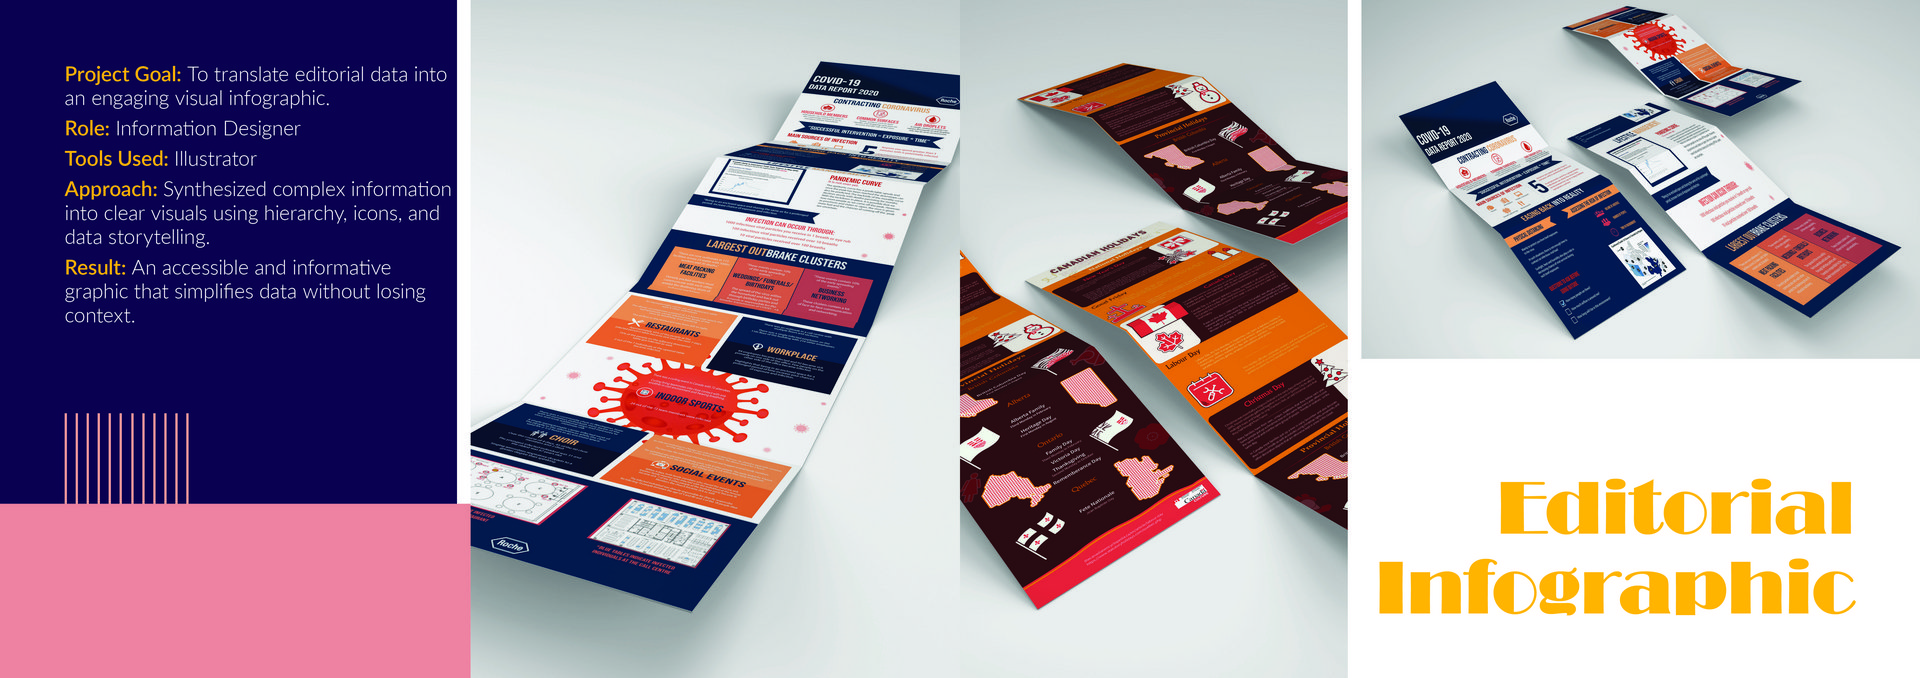
Project Goal: To translate editorial data into an engaging visual infographic.
Role: Information Designer
Tools Used: Illustrator
Approach: Synthesized complex information into clear visuals using hierarchy, icons, and data storytelling.
Result: An accessible and informative graphic that simplifies data without losing context.