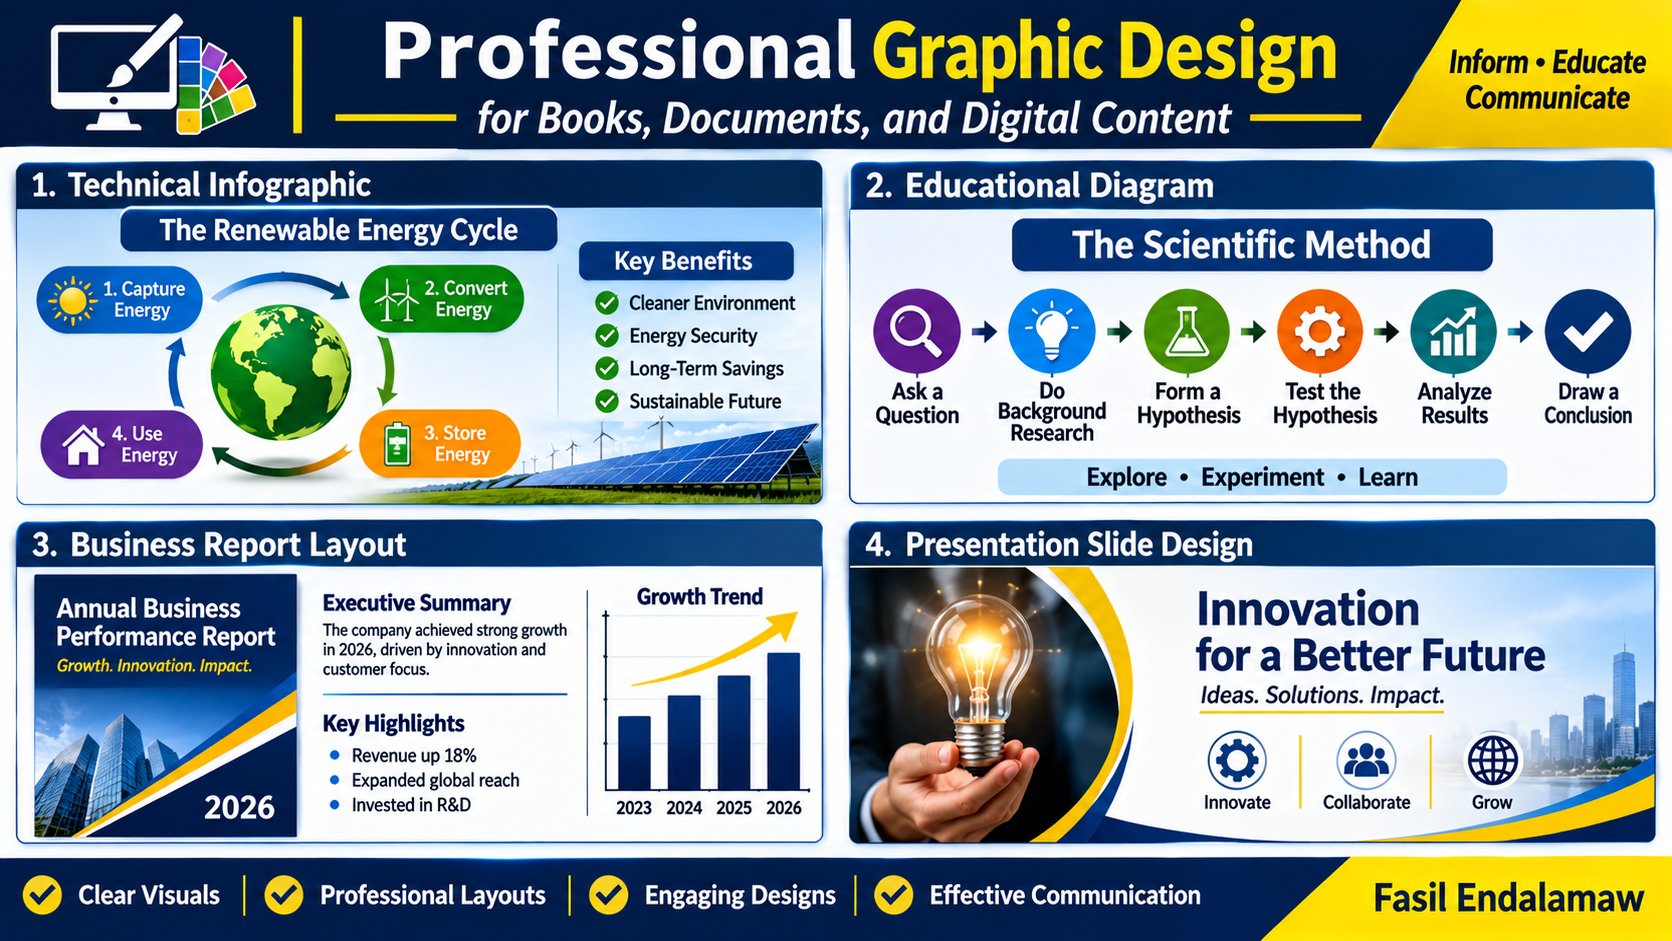
INFOGRAPHIC, TECHNICAL DIAGRAM & VISUAL COMMUNICATION DESIGN
Fasil Endalamaw Hailu
Published
INFOGRAPHIC, TECHNICAL DIAGRAM & VISUAL COMMUNICATION DESIGN
PROJECT OVERVIEW
I design structured visual materials that communicate complex information through clear diagrams, infographics, flowcharts, and technical illustrations.
Combining engineering knowledge, technical writing, educational content development, and graphic design, I transform information into organized visual resources that support understanding, explanation, and practical application.
DESIGN SERVICES
- Technical Diagrams: Engineering illustrations, circuit diagrams, system architectures, and conceptual models.
- Infographics: Educational, technical, research, and business information presented visually.
- Process Flowcharts: Workflows, decision processes, operational sequences, and procedures.
- Educational Visuals: Learning frameworks, explanatory diagrams, and instructional illustrations.
- Research Graphics: Conceptual frameworks, comparison charts, and research-process visualizations.
- Data Presentation: Tables, charts, and structured graphical summaries.
DESIGN APPROACH
Every visual begins with understanding the information, its intended audience, and its communication purpose.
My design priorities include:
- Logical organization and information hierarchy.
- Clear labels, annotations, and visual relationships.
- Consistent typography and visual styling.
- Accurate representation of supplied technical information.
- Readability and effective use of space.
- Appropriate visual complexity for the intended audience.
AREAS OF APPLICATION
My work covers engineering and technology, microelectronics, digital systems, artificial intelligence, academic research, education, business processes, and nonfiction publishing.
I pay particular attention to technical clarity when presenting complex concepts, processes, and relationships.
PROJECT DELIVERABLES
- Technical diagrams and engineering illustrations.
- Educational and research infographics.
- Process flowcharts and workflow diagrams.
- Conceptual models and visual frameworks.
- Charts, tables, and comparison graphics.
- High-resolution PNG and JPG graphics.
- Editable presentation or vector files when included in the project scope.
SPECIALTIES: Infographic Design | Technical Diagrams | Engineering Visualization | Flowcharts | Educational Graphics | Research Visualization | Visual Communication