Green Candle Research Academy | Client Dashboard UI/UX
Harshi Adamya
Published
0
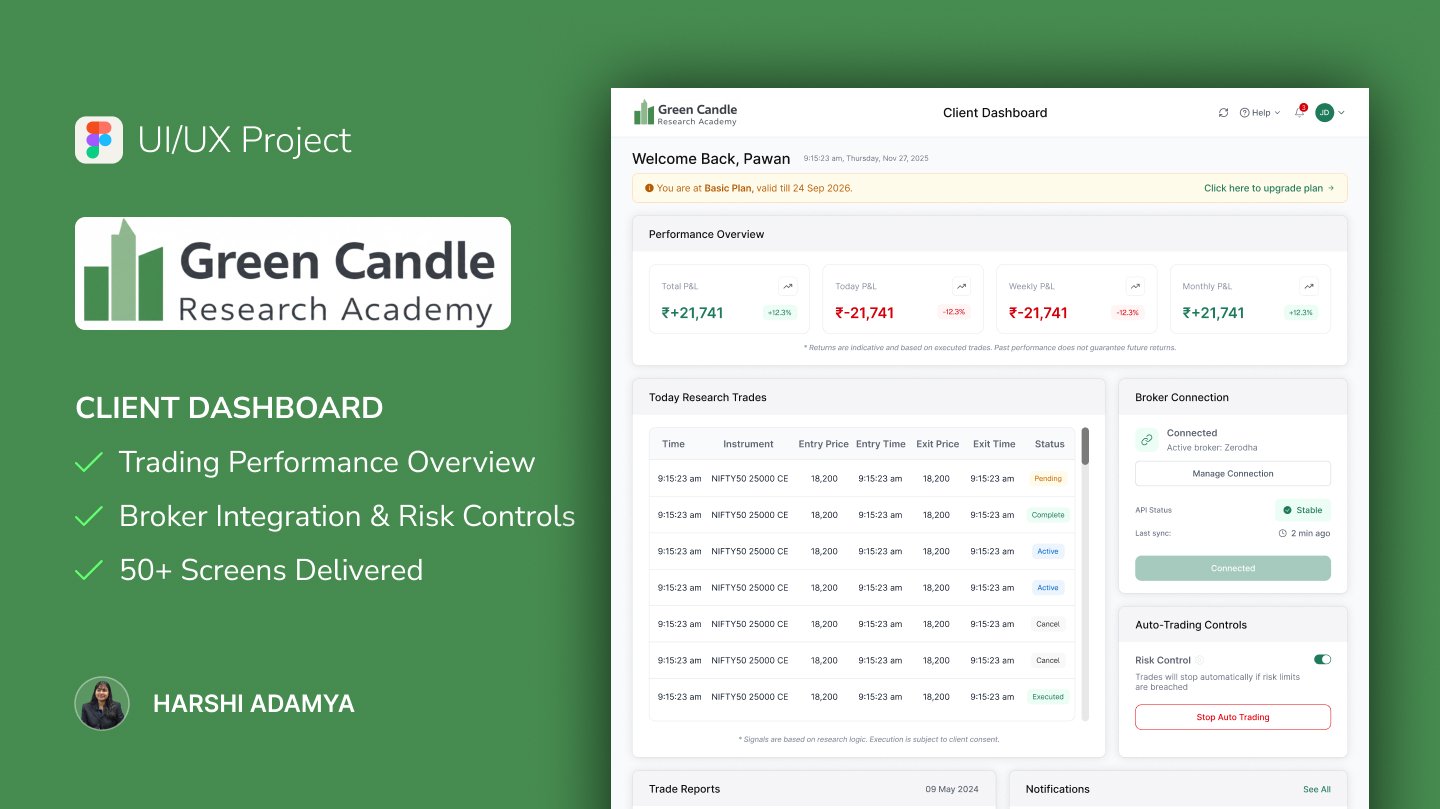
Green Candle Research Academy’s client dashboard is designed to help users monitor trading performance, access research reports, manage broker connections, and control automated trading through a centralized interface.
Figma Link : https://www.twine.net/signin
My focus was on designing an intuitive dashboard that presents complex financial data in a structured, easy-to-understand format. The experience brings together performance metrics, trade history, research and client reports, subscription plans, notifications, and account settings to help users navigate their trading activities more efficiently.
Key Features
- Performance Overview: At-a-glance P&L metrics and trading performance summaries.
- Trade Management: Organized trade history with entry and exit details, timestamps, and status indicators.
- Broker Integration: Broker connection, account linking, and connection status management.
- Trading Controls: Risk management settings and automated trading controls.
- Research & Client Reports: Detailed performance charts, trade summaries, and financial insights.
- Account Management: Subscription plans, profile settings, notifications, FAQs, and referral features.