Presentation Design, Turning Spreadsheets into a Visual Story
Josyy Kay
Published
0
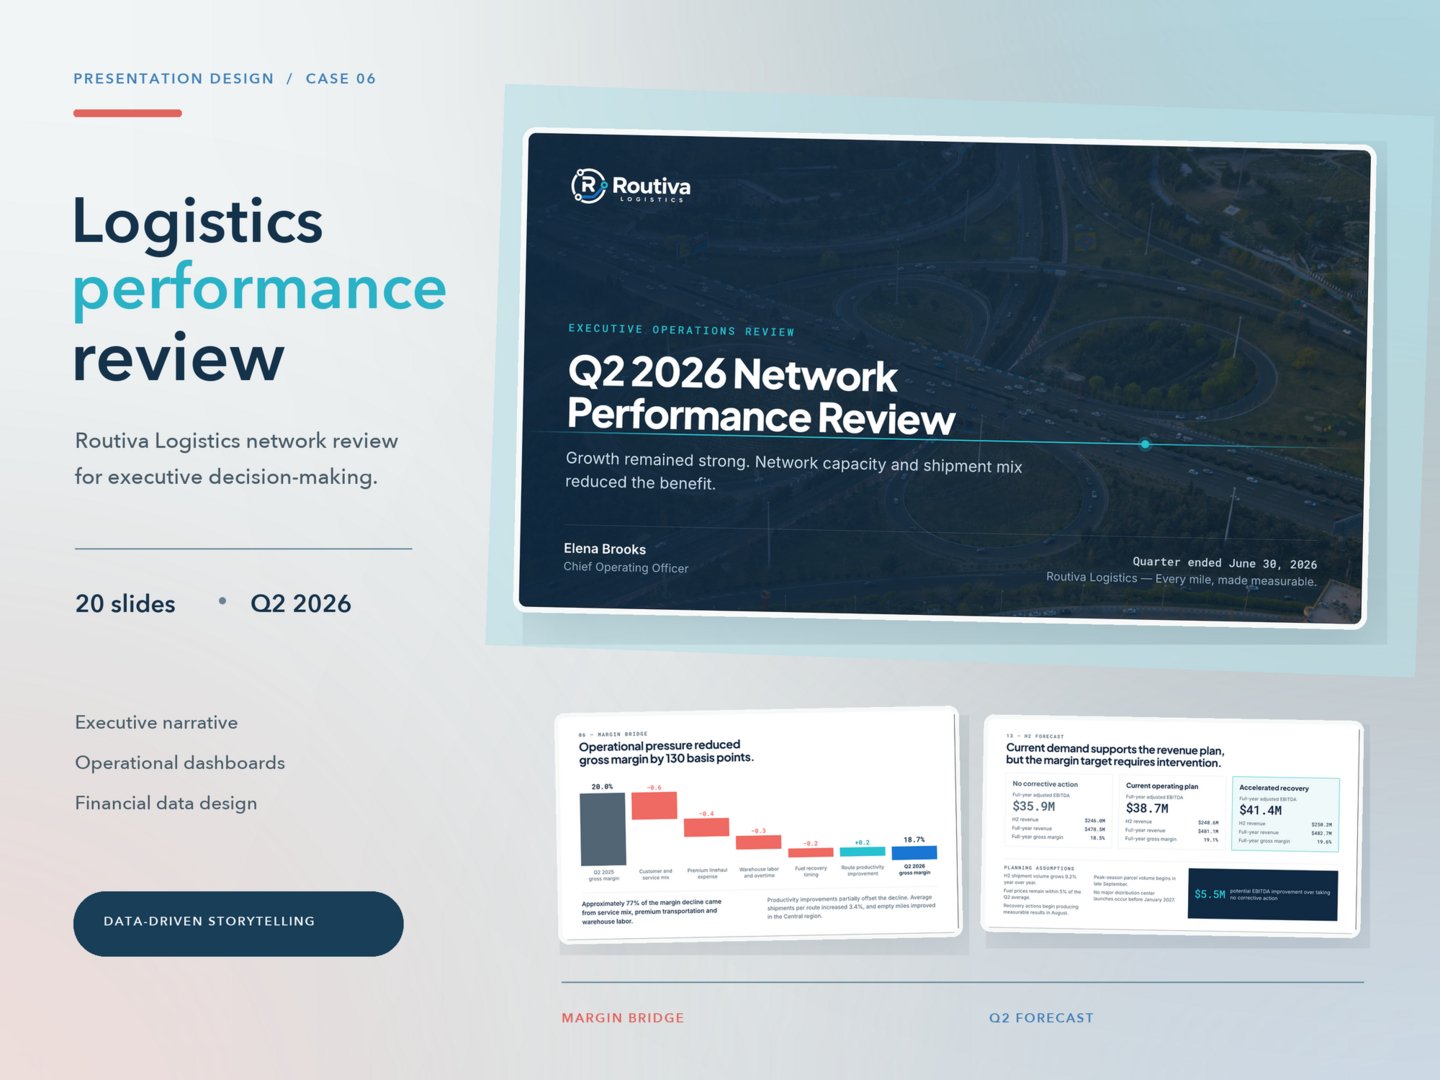
The hardest deck to design is the one that arrives as a spreadsheet. Routiva is a 20-slide quarterly network performance review I designed for a concept logistics company, a data-heavy executive deck that consolidates 14 spreadsheet tabs, 1,248 cells, 37 disconnected charts, and 11 competing KPI definitions into one business story with five clear decisions. Full-sentence verdict headlines, directly labeled charts, color-coded performance tables, and decision-rule callouts turn raw operations data into an argument a leadership team can act on. Built in PowerPoint, editable in Google Slides.